
Defining Immunogenicity for Immunogenicity Prediction
Predicting T-cell immunogenicity, or the ability of peptides to elicit a T-cell response, is a critical element of vaccine design. This post looks at the nuance surrounding immunogenicity and how standardizing its quantification across contexts remains understudied. Here, I examine the motivations for formalizing in-context definitions for immunogenicity and propose a quantification method that is broadly applicable to a number of T-cell contexts, including peptide vaccine design.
Note: There are different types of immunogenicity depending on the type of immune response elicited such as humoral immunogenicity (B-cell) and cell-mediated immunogenicity (T-cell). For brevity, all further references of immunogenicity will be referring to cell-mediated immunogenicity, a concept I break down here.

MHC-I and MHC-II Presentation Pathways (source)
Background & Motivations
T-cell immune responses require the synergistic operation of a number of sub-cellular events by both the antigen presenting cell as well as the responding T-cell. Canonically, these events can broadly be categorized as falling within: antigen presentation, and TCR recognition (shown above). However, there is a third category of events which, for lack of a consensus term, I call promotion/attenuation that also plays a key part in determining immune response. This category encompasses the expanse of immune checkpoint + co-stimulatory interactions with surface receptors on T-cells to either promote or attenuate that cell’s effector function. Predicting immunogenicity requires accurately predicting all three events.
In a perfect world, with unlimited access to information, we could predict immunogenicity of a peptide in an individual by first looking at the different surface MHC molecules and predicting how stable the peptide will bind MHC and stay presented. Then we could look at the individual’s entire TCR repertoire and predict how many TCRs would react and bind the peptide-MHC (pMHC) conjugate. Last, we would need to check the activation/senescence cell states of the reactive TCRs and count how many clones will initiate effector function. Immunogenicity could thus be found as some weighted score involving the presentation, recognition, and activation propensities. In the real world however, we have nowhere near this level of data available, and must go about immunogenicity prediction in more roundabout ways.
Current Landscape of Immunogenicity Prediction
Because data on attenuators and promotors vary on a clonotype level within an individual and across individuals (affected by prior/concurrent infections), along with other variables, much focus has been placed on first predicting presentation and recognition. Tools like NetMHCpan and MHCFlurry have achieved high accuracy in predicting peptide presentation, whereas no tools have emerged that perform on a similar caliber at predicting TCR recognition. Buckley et al benchmarked a number of immunogenicity predictors and reported that immunogenicity prediction (IP) of arbitrary peptides fails to outperform simple predictors of peptide presentation, indicating an apparent need to better predict TCR recognition. I suspect this is due in large part to the fact that training data used for IP is almost always binarized. Thus, to explicitly train models to learn and predict TCR recognition (which can vary wildly), perhaps a more meaningful metric of quantifying TCR recognition propensities needs to be used as training data.
Current Landscape of Available Immunogenicity Data
Immunogencity data as a whole is siloed by assay of origin. To measure the presentation of a specific peptide there MHC presentation assays. Common assays are for measuring T-cell response include: ELISA/ELISpot, multimer, intracellular stains, proliferation assays, and degranulation assays. These assays are optimal for answering various scientific questions. For example, to check for reactive TCRs: a multimer assay would tell if certain TCRs bind a specific multimer. However, to check if TCR recognition leads to an immune response these multimer+ cells would need to be assayed via intracellular stain or other functional assays. To perfectly check for the TCR recognition propensity of a pMHC, we’d need an exhaustive set of the entire TCR space and a mechanism to check what proportion of this set reacts with a given pMHC. However, because the available TCR space is ~10^15 and each TCR has the ability to bind multiple pMHCs, there is a need to collect assay data from many individuals, in hopes of sampling from the set of TCRs. The IEDB is a comprehensive database with such a dataset that looks at studies where the immunogenicity of specific pMHCs were tested across multiple individuals.
Defining TCR Recognition Propensity with IEDB
From the perspective of PIRL, one of our goals is to create personalized cancer vaccines. So one of the reasons we work on IP is to be able to rank putative neoantigens such that the highest ranked peptides are those that selected for inclusion in a vaccine. In this exploration which is available here as an iPython notebook, I took a look at subset of the available IEDB data that was filtered on MHC-I data and was generated from multimer assay data. We specifically chose this assay as a high confidence assay where we could claim that there were reactive TCRs to the given multimer (pMHC). This reduces immunogenicity from presentation and recognition to just recognition because we condition on the event that the peptide has been presented by the MHC on the multimer. A snapshot of the dataset is shown below.
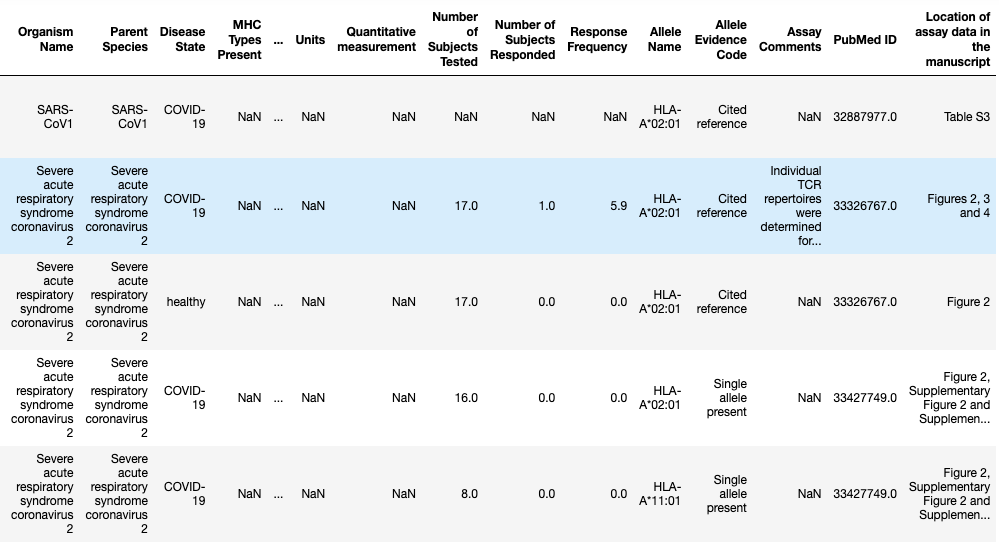
Sample of IEDB Multimer Assay Data (MHC-I)
When looking at the data from the IEDB, we run into the issue that for a given peptide MHC, there are a number of different studies reporting the immunogenicity of that pMHC. Each quantify the immunogenicity of the pMHC in slightly different ways, and in some instances, the studies do not agree with each other. Some include quantitative measurements, and some include qualitative measurements with labels spanning (Immunogenic, Immunogenic-strong, Immunogenic-weak, and Non-immunogenic). Thus, a standardized quantification of TCR recognition needs to be crafted that makes use of the variability of the multimers’ ability to bind TCRs and be classified as positive staining. I decided to look at the number of subjects responded over the number of subjects tested as a standardized method of quantifying TCR recognition across a number of TCR repertoires. Like from the second thought experiment scenario, the idea was that when we look across various individuals, the pMHCs with a higher propensity for TCR recognition will stimulate a representative sample of TCRs with a higher frequency.
Once I chose this as my given metric, I needed to perform data imputation for the cases where the number of individuals tested was not given. In this case, I looked through a few of the papers that didn’t cite the number of individuals tested and found from those papers, that only one individual was tested. So I chose n_tested = 1 for those cases. Furthermore, in order to include some degree of uncertainty for the ratios where only a few number of individuals was tested I decided to use Laplace smoothing to add two dummy individuals to the each case: responded as well as didn’t respond. This smoothing made it such that those pMHCs where a large number of individuals were tested and a majority either responded or didn’t respond, the change to the ratio would be minimal. However if only one individual was tested and either responded or didn’t respond the smoothing pulled the ratio down from 1.00 or up from 0.00.

Laplace Smoothing Scheme
From here I needed to collate various experiments together that looked at the same pMHC. There are a number of options of how to handle the variability among the results we get combining across experiments. We can treat them as one giant experiment and sum over all the total responded and total tested. However, I decided against this because each experiment was performed separately and I felt that batch effects may somehow confound this. I entertained drawing a sample of outcomes with sampling probabilities equal to the empirical distribution, bootstrapping, and even taking the geometric average. For a first pass approach, I ended up choosing a modified geometric mean that is weighted by the number of individuals tested (personal choice that behaved well with the example above and when class switched).

Below we can see what went from a list of disparate metrics of measuring immunogenicity projected onto a standard axis with a biologically relevant meaning. In future work I will be comparing the performance of models trained on this dataset versus models trained on the binarized version of this dataset. This work is still in progress and I aim to also test out other imputation schemes as well as other methods of combining across experiments, but I do anticipate better performance on downstream predictors from this data. The results and pipeline have been made readily available for the community if anyone is working on IP and likewise thinks that there must be something better than binarized data to train on.

Snapshot of transformed data with new quantification of TCR recognition (y).